The Ball Formula method uses heating factors to calculate process times. These Heating Factors are generated from the evaluation of heat penetration test data. The time/temperature data for each thermocoupled container is plotted on an inverted, semi-logarithmic graph. This graph is developed based on the Retort Temperature and the Come Up Time experienced by the test containers during the heat penetration test. "Free Leads" are used during the HP test to record the Retort Temperature around the test containers.
CALSoft helps you determine the Retort Temperature (RT) and Come-Up Time (CUT) that should be used for plotting the heat penetration data. By default, CALSoft will choose the RT and CUT based on the temperatures recorded by the Free Leads in the HP test. You can either:
(a) Choose to accept these values for each HP data file selected
(b) Edit the RT and/or CUT by simply typing over the default values
(c) Use CALSoft's "PLOTTING DEFAULTS ASSISTANT" to drill-down and look at each Free Lead separately
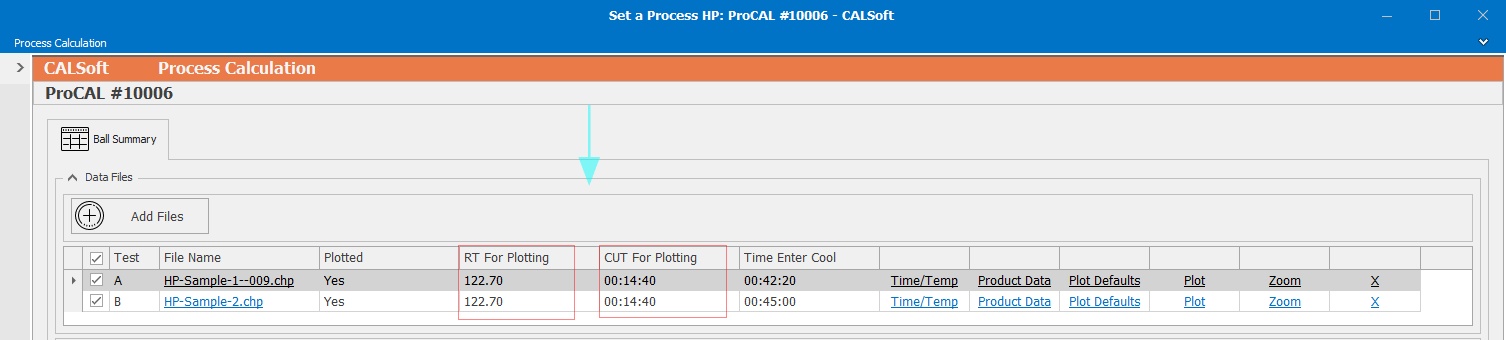
Once you set your RT and CUT, you can begin plotting your data.
Using CALSoft's Plotting Defaults Assistant:
If you would like CALSoft to help you determine the RT and CUT to use for plotting, you can either do this on the HP File Screen in the "Ball Plotting" section (click "Plotting Defaults Assistant"), or on the Procss Calculation "Ball Summary" tab (click "Plot Defaults" next to a specific HP file).

This will launch the assistant and you must:
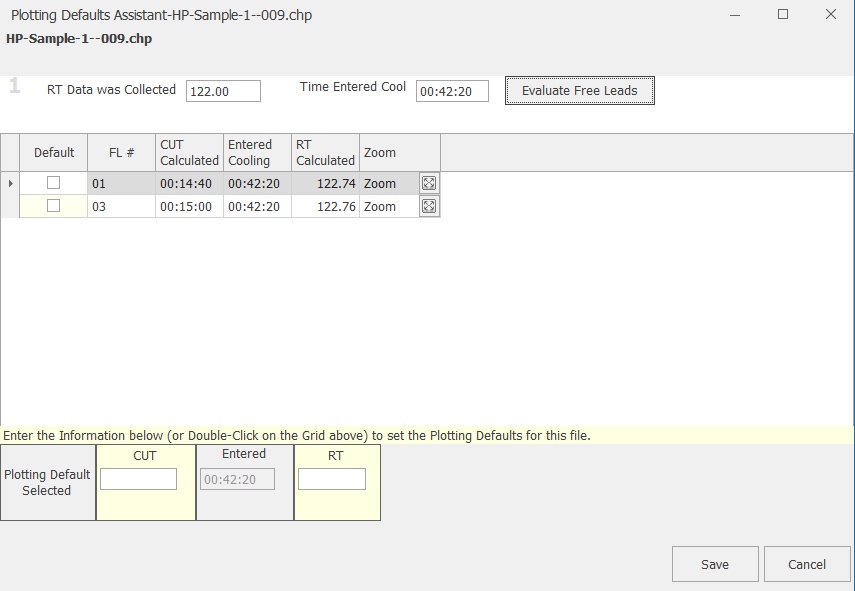
- Enter the Retort Temperature that the HP data was collected
- Enter the Time the retort Entered Cooling during the HP test
- Then choose "EVALUATE FREE LEADS"
CALSoft will then calculate
(1) the time that each Free Lead reached the RT (Come Up Time), which will be listed for each Free Lead as the "CUT Calculated," and
(2) the Retort Temperature that the test containers experienced during the HP test for each FREE LEAD. CALSoft accomplishes this by calculating the average temperature from the time CUT was achieved at that Free Lead until the time that the retort went into Cooling during the HP test. CALSoft will display this as the "RT Calculated" for each Free Lead.
You can evaluate the information even further by using the Zoom Plotting feature to look at a graph of this time/temperature data for each free lead. This may help you to more accurately decide which CUT and RT to use for Plotting to obtain Ball Formula Heating factors. To access this, simply click "Zoom."
Once you have decided on a CUT and RT to use for the plotting, you can either (a) check the Free Lead you would like to use, or (b) enter the information yourself at the bottom. Click "SAVE" when you are done. Complete this exercise for each HP data file that you plan to plot.
Once you set your RT and CUT, you can begin plotting your data.