CALSoft automatically plots your heat penetration data on an inverted, semi-logarithmic graph using the RT and CUT as determined by the user. The following tips will help you better understand how you can use this function in CALSoft:

The graph is generated using the Retort Temperature (RT) and Come Up time (CUT) experienced by the test containers. The RT and CUT used to generate the graph are shown under the PLOTTED USING section.
________________________________________________________________________________________________________________
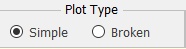
Toggle between "Simple" or "Broken" under PLOT TYPE to change the plot. CALSoft will automatically choose the best-fit of the line for the plotted data.
Simple Curves represent "straight line heating" and have a single red line to represent the heat penetration data. This line determines the jh and fh.
Broken Curves represent heating inside a container that may start very fast, but then slow down over time. This curve uses two lines to represent the heat penetration data. The first line (red) determines the jh and fh and the second line (blue) determines the f2. The point where the two lines intersect is the xbh.
________________________________________________________________________________________________________________
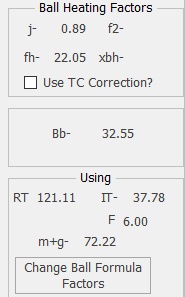
The Ball Formula method uses heating factors to calculate process times and lethalities. Heating factors (j, fh, fx, and xbh) are automatically calculated by CALSoft based on the Simple or Broken line that is fit to the plotted heat penetration data. These are found in the BALL HEATING FACTORS section. Heating factors will change as you move the line on the plotted data.
The "Bb" is the Ball Formula calculated cook time using the heating factors derived from the plot, and other factors:
- RT (Retort Temperature for process calculation)
- IT (product Initial Temperature for process calculation)
- m+g (difference between retort temperature and cooling water temperature)
- F value (chosen by Process Authority based on product)
To change these factors, click the "Change Ball Formula Factors" button.
NOTE: The Process Factors and RT/IT ranges can be set in PREFERENCES. To access this, select "Preferences" in the top Ribbon Menu on the HP File Screen or at the top right on the main CALSoft homepage, and then choose the "Process Factors" tab.
________________________________________________________________________________________________________________

To quickly review plots, you can choose the option to use the CONTROL (Ctrl) key on your keyboard. When this option is selected, the plot/lead will be marked as REVIEWED if you press the Control key. This makes data evaluation quicker as you do not have to point and click "Reviewed" after you are finished reviewing each plot, you can simply hit the Control key on your keyboard. Uncheck this to disable this option.
________________________________________________________________________________________________________________
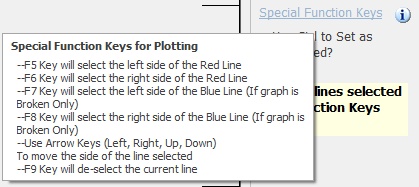
CALSoft enables you to use your mouse to adjust the lines on the plotted heat penetration data... or you can use the Arrow Keys on your keyboard for a more precise movement of the lines. Hover your mouse over the "Special Function Keys" link and you will see instructions on how to select the line with your function keys and to move the line with your Arrow Keys.