Click the “Pre Come Up Time Plot" button in the ribbon menu on the TD File Screen to access this unique graphing feature on CALSoft.
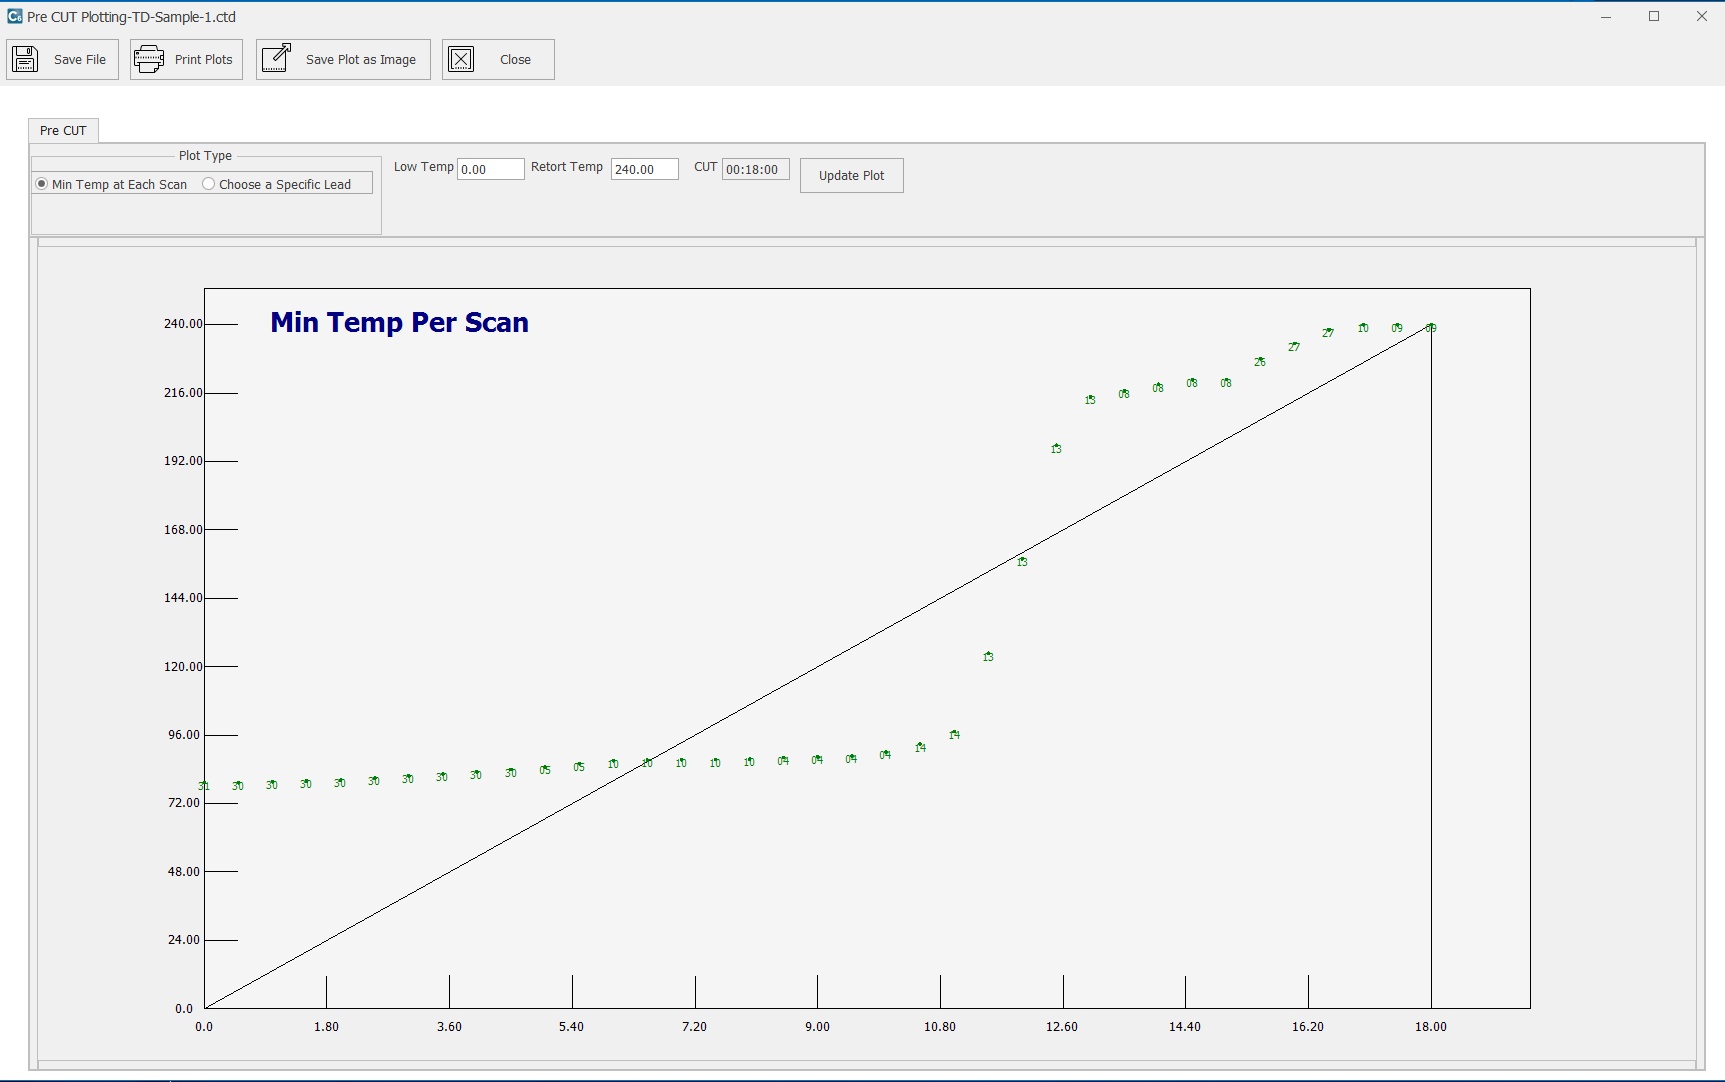
For each Temperature Distribution data file, CALSoft will plot the "Pre-CUT" Plot. To generate this plot, CALSoft determines the minimum temperature at each scan and plots that, related to the Come Up Time (CUT), on a time/temperature grid. A straight-line is then plotted from the start of the test through the Come Up Time (CUT). When properly used, this Pre-CUT plot will help you to determine if come up time credit can be used in the Ball formula calculation.
You have the ability to choose to plot the minimum temperature at each scan (taking into account all the leads) or the minimum temperature at each scan for a single specific lead.
It should be noted that only those leads that are classified as free leads will be used in performing the "Pre-Come Up" analysis. If your leads are not correctly classified, then go to the Equipment section on the TD File Screen.
You can choose to Print the Plot as well as Save the Plot as an Image (.bmp Bit Map only).