You can access a Min/Max Plot from within a TD file.
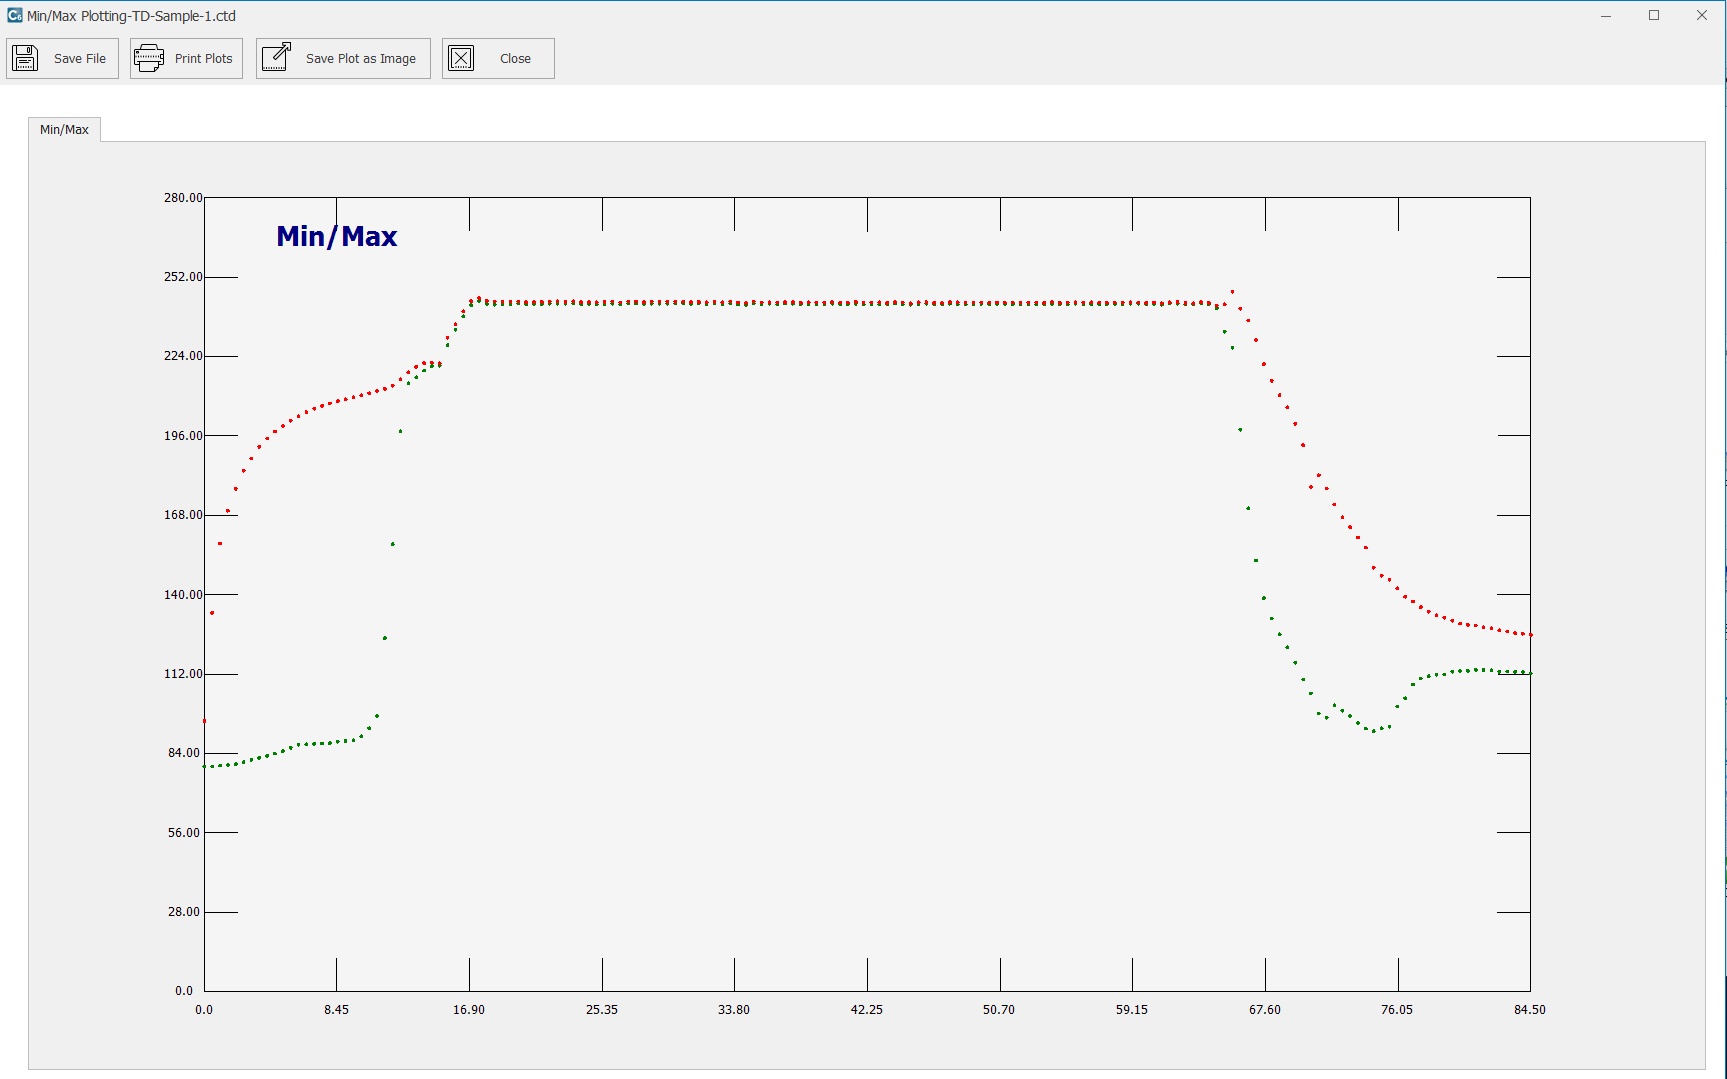
For each Temperature Distribution data file, CALSoft will plot the "Min/Max" readings for each scan. This plotted data will help you to visually evaluate the difference in the high and low temperatures in the retort during the cycle that was tested.
It should be noted that only those leads that are classified as free leads will be used in performing the Min/Max analysis. If your leads are not correctly classified, then go to the Equipment section on the TD File Screen.
You can choose to Print the Plot as well as Save the Plot as an Image (.bmp Bit Map only).