Click on the "Zoom" button in the ribbon (or in the Ball Plotting section) on the HP File Screen to access CALSoft’s unique graphing feature. CALSoft’s “Zoom” utility plots the time/temperature data on a graph and then allows you to “ZOOM IN” on the data by using your cursor to select the part of the graph you want to zoom into.
(Click here for a general overview of the Zoom screen)
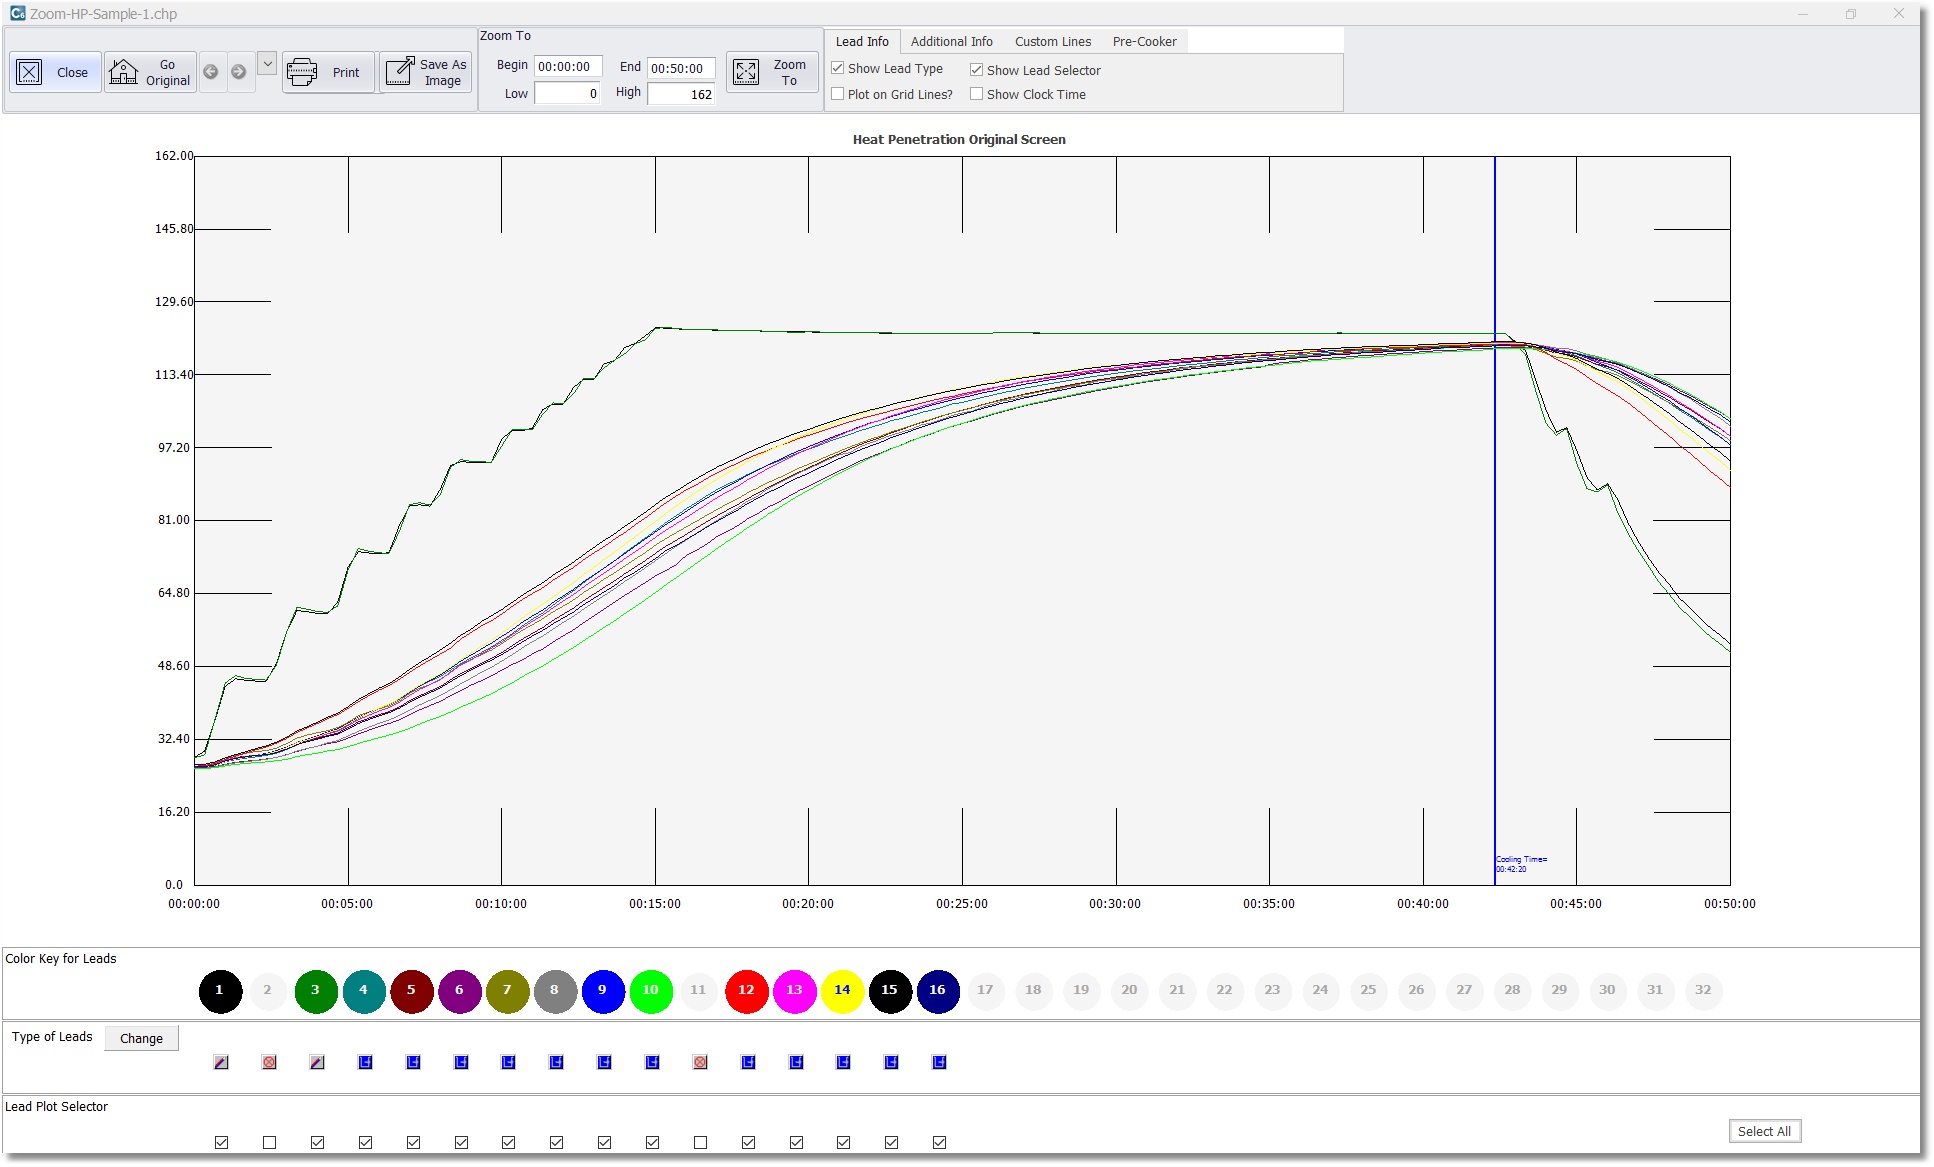
Once on the Zoom screen, you can view and customize the graph in a number of ways:
Zooming In/Out:
- To “Zoom” into a specific part of the graph, click and drag your mouse to highlight the area that you wish to zoom into. When you let go of the mouse button, the page will redraw the graph and zoom into the plotted data, using the coordinates you selected.
- After zooming to a graph with certain coordinates, that specific graph is saved. Click the left or right arrows on the top left of the page to go back (or forward) to a previous graph. Click the dropdown arrow to select one of your previous zoom graphs.
- To "Zoom" back out to the original full graph, click "Go Original."
- To create your own grid, go to the "Zoom To" section and enter specific start and end times, and specific high and low temperatures. Then click "Zoom To" and a graph will be generated based on you custom coordinates and the data will be replotted accordingly.
Lead Info:
- Click the checkbox next to "Show Lead Type" to toggle on and off the lead type indicators at the bottom of the page.
- Click the checkbox next to "Show Lead Selector" to toggle on and off the lead plot selector at the bottom of the page.
- Click the checkbox next to "Plot on Grid Lines?" to toggle on and off the grid lines on the graph.
- Click the checkbox next to "Show Clock Time" to toggle on and off clock time instead of elapsed test time.
Additional Info:
- Click the checkbox next to "Show Cooling" to display a vertical line on the graph, indicating the time cooling began.
- Click the checkbox next to "Show Time Entered Cook" to display a vertical line on the graph, indicating the time cook began.
Custom Lines:
- To display a custom time or temperature line on the graph, click "Add," check either "Time Line" or "Temp Line," enter a time or temp in the box, and then click "Update."
- To edit a custom time or temperature line, click the dropdown box and select one of your custom lines, click "Edit" and then change the time/temp and click "Update."
Displaying Leads on the Graph:
- To change the lead type for a specific lead, go to the "Type of Leads" section and click "Change" and then select the type of lead, to indicate whether it will be designated as a "free lead" or a "thermocoupled container" in the data file (or remove the lead from the grid by marking it as "bad data" or an "open channel").
- To display or hide one or more leads plotted on the graph, go to the "Lead Plot Selector" section and either check or uncheck the box under a specific lead.
Printing/Saving:
- To print the graph, click "Print."
- To save the graph as a BMP image file, click "Save As Image."