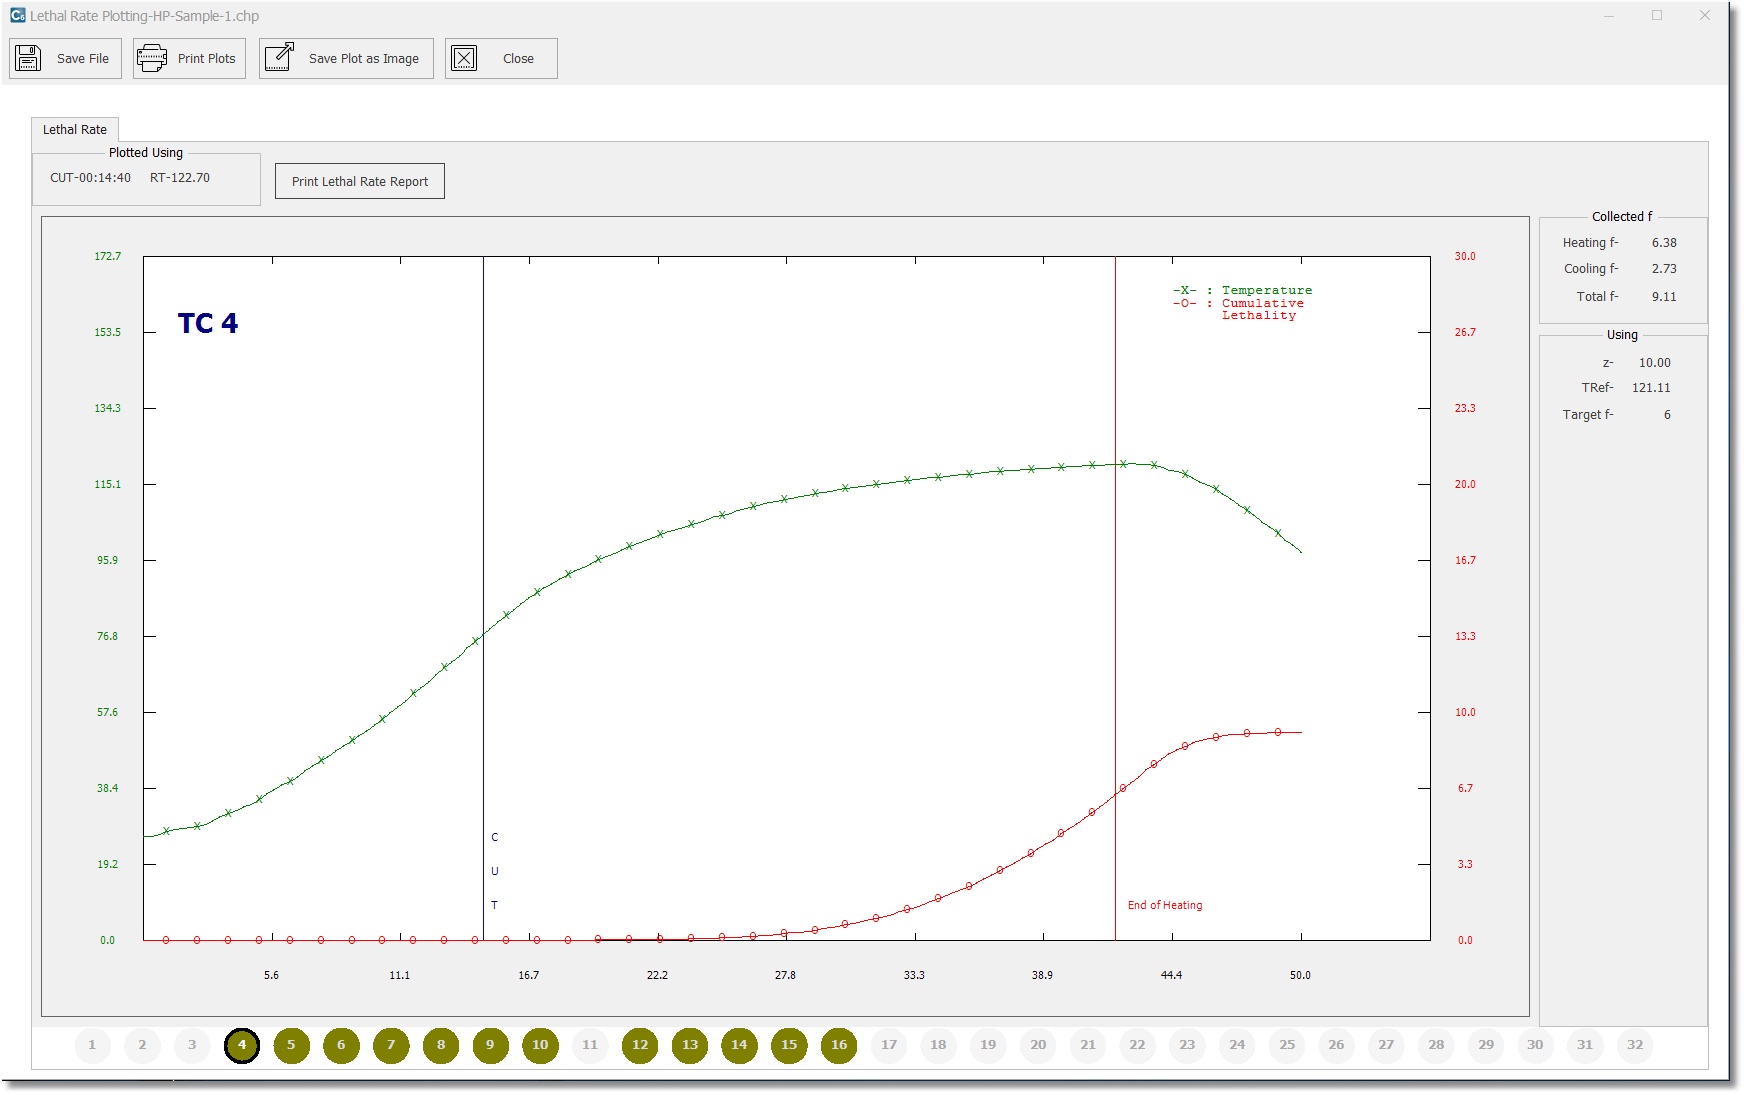
CALSoft automatically plots the temperature and lethal rate of each thermocoupled container in each heat penetration test using x, y, and z axes. The x-axis is time (total test duration (heating and cooling)), the y-axis is the temperature reading from that thermocoupled container, and the z-axis is the accumulated lethality (Fo). The plot contains the plotted thermocouple selected over time, and the cumulative Fo over time. This plot is linear, not logarithmic. The General Method z and Tref used in the accumulated F calculation are listed on the right of the plot, along with the total accumulated F during heating, cooling, and the entire test.
You may also print a Lethal Rate Report for a specific thermocouple (click "Print Lethal Rate Report"). This report is for a single lead within an HP data file and shows Time/Temperature/Lethal Rate/Cumulative Lethality for each data scan for that particular lead.