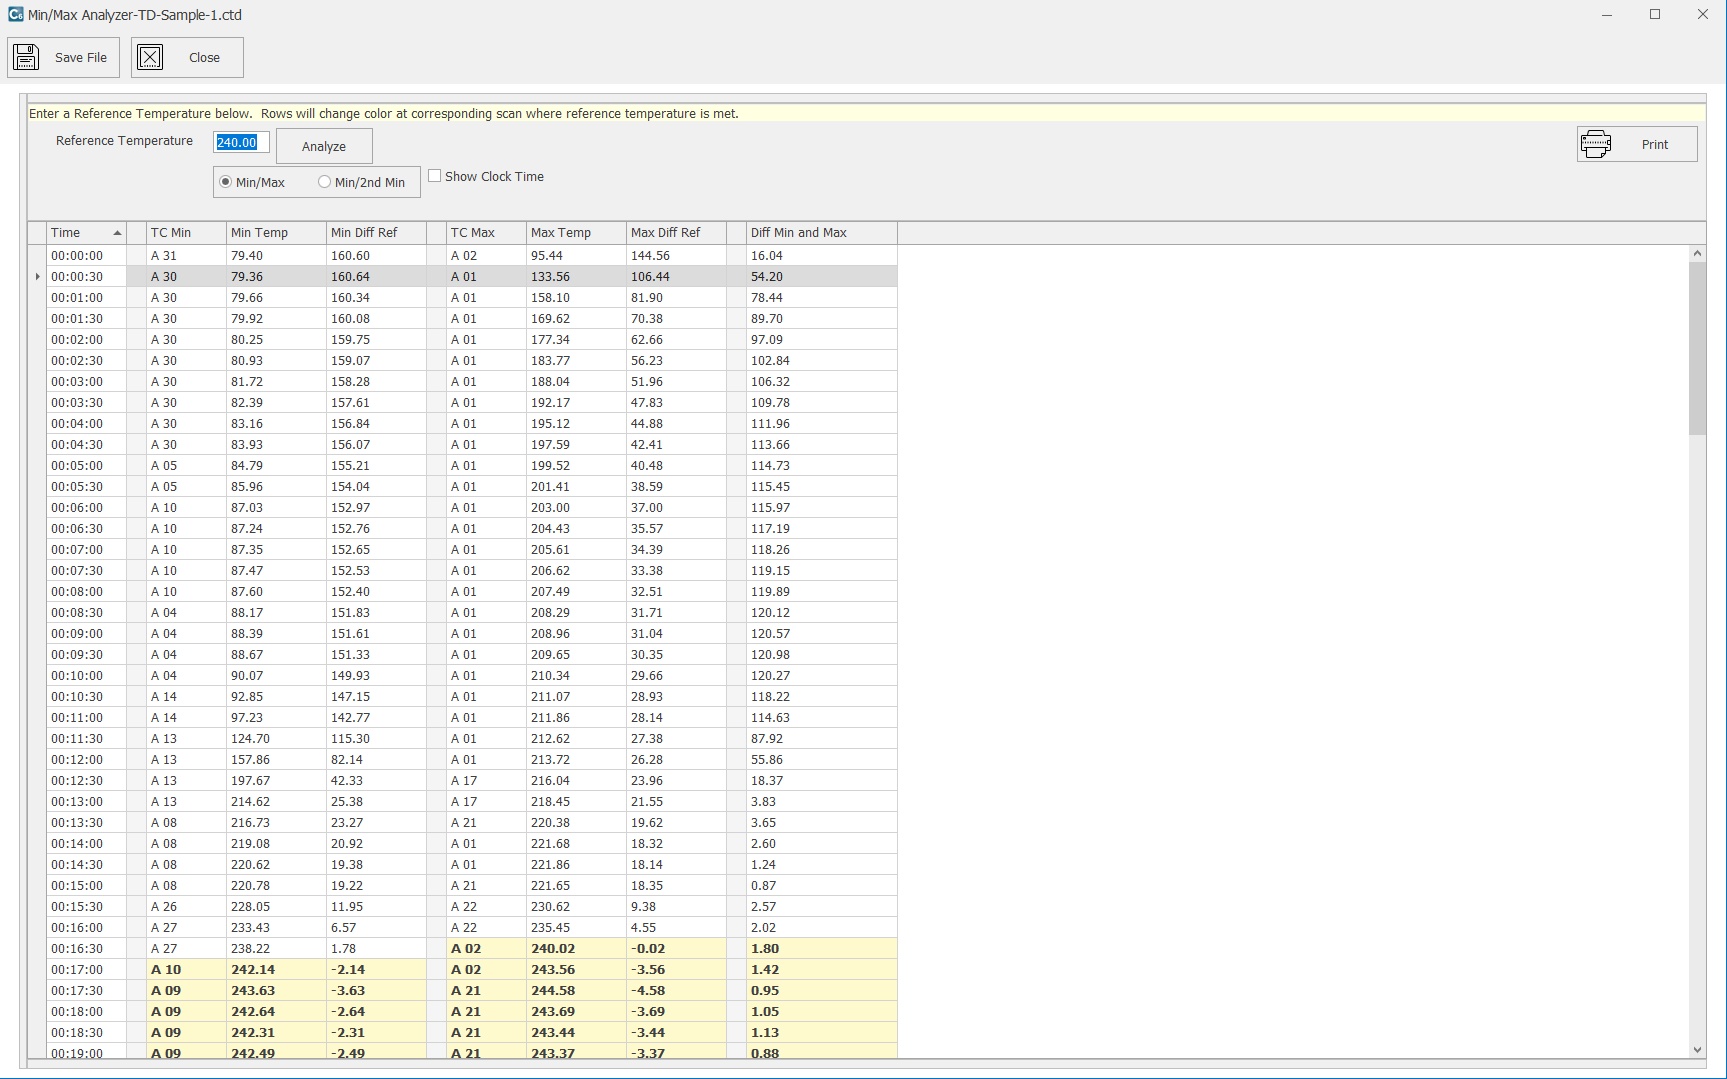
With the TD Min/Max Analyzer, CALSoft will analyze the data for your current TD File. You can choose to display the 2 minimum readings from each scan (Min/Min or "Min/2nd Min") or the minimum and maximum from each scan (Min/Max). The Main Grid shows each reading (Min/Min or Min/Max) at each scan. The Grid also displays the difference the scan has from the reference temperature (Diff Ref) as well as the difference between the Min and Max of each scan (Diff Min and Max).
Enter a "REFERENCE TEMPERATURE" and click "Analyze" and CALSoft will scan the data and visually mark the scans where that temperature has been reached or exceeded by marking them in a different color (Orange) and making the text bold. This feature will help you to determine at what time a certain temperature has been achieved during the TD tests. Multiple Files may be analyzed at once using this feature.
You can select the "Show Clock Time" checkbox to display the actual time-of-day clock time along with the elapsed test time.
Click the "Print" button to print the min/max or min/min data to a pdf.
It should be noted that only those leads that are classified as free leads will be used in performing the Min/Max and Min/Min analysis. If your leads are not correctly classified, then go to the Equipment section on the TD File Screen.