Click on the "Zoom" button in the ribbon (or in the Ball Plotting section) on the HP File Screen to access CALSoft’s unique graphing feature. CALSoft’s “Zoom” utility plots the time/temperature data on a graph and then allows you to “ZOOM IN” on the data by using your cursor to select the part of the graph you want to zoom into.
Features of Zoom include:
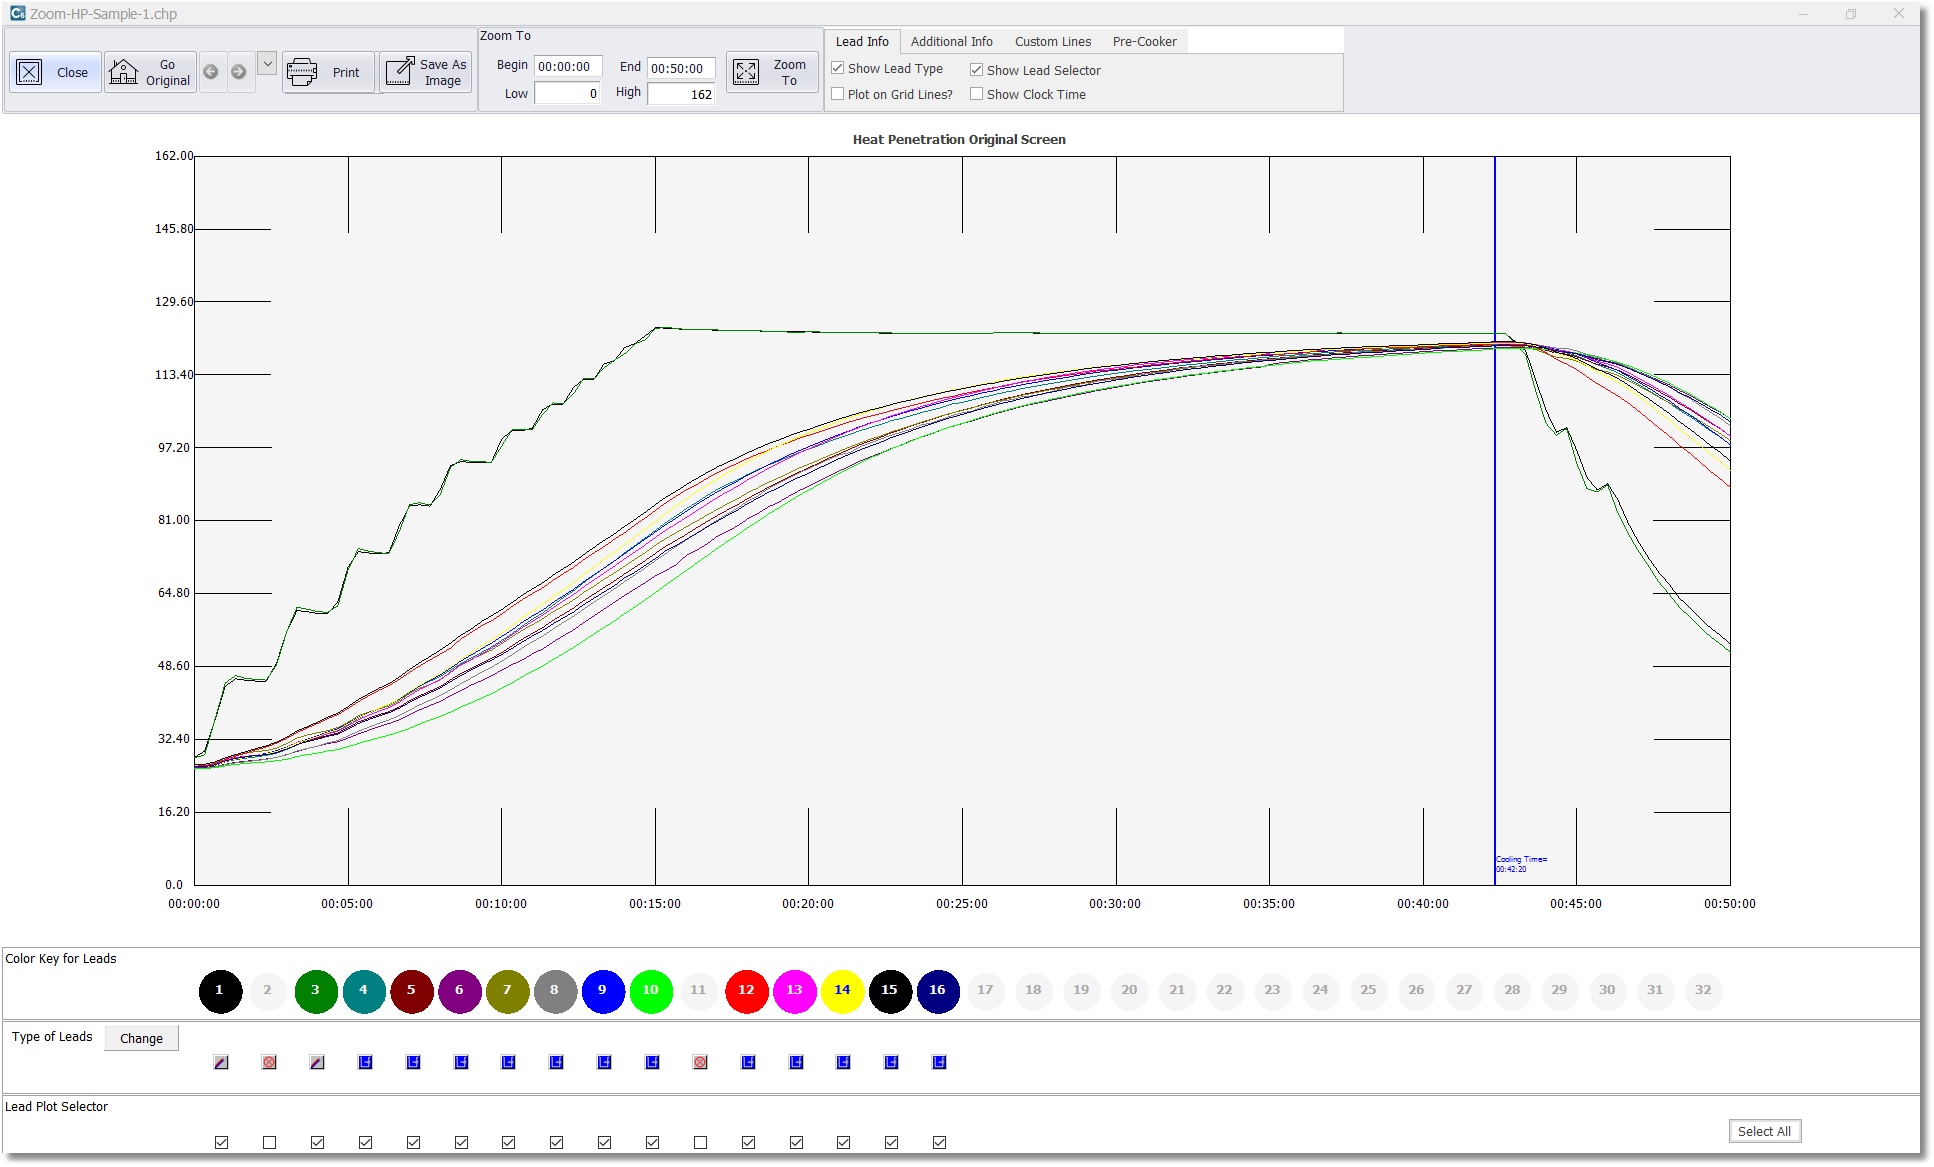
Top of zoom screen (from left to right):
- Close: Exit the zoom screen.
- Go Original: Zoom back out to the original full graph.
- Print: Print the graph.
- Save As Image: Save the graph as a BMP image file.
- Zoom To: This feature allows you to create your own grid by entering specific times and temperatures. Zoom will use this to generate the graph and replot the data accordingly.
- Lead Info: This feature allows you to toggle on and off the lead type and selector at the bottom of the page, the grid lines on the graph, and clock time instead of elapsed test time.
- Additional Info: This feature allows you to add a line to your graphs for additional times that were recorded into the data file during the test, such as cooling start time and cook start time. When selected these will show as vertical lines on the graph. If no data has been entered into the data file for these specific events, nothing will show on the graph.
- Custom Lines: This feature allows you to display a custom time or temperature line on the graph.
Bottom of zoom screen:
- Type of Leads: This indicates whether the lead being plotted is designated as a “free lead” or a “thermocoupled container” in the data file.
- Lead Plot Selector: This allows you to display or hide one or more leads plotted on the graph.
Click here for more information on using the CALSoft Zoom Plotting Feature.