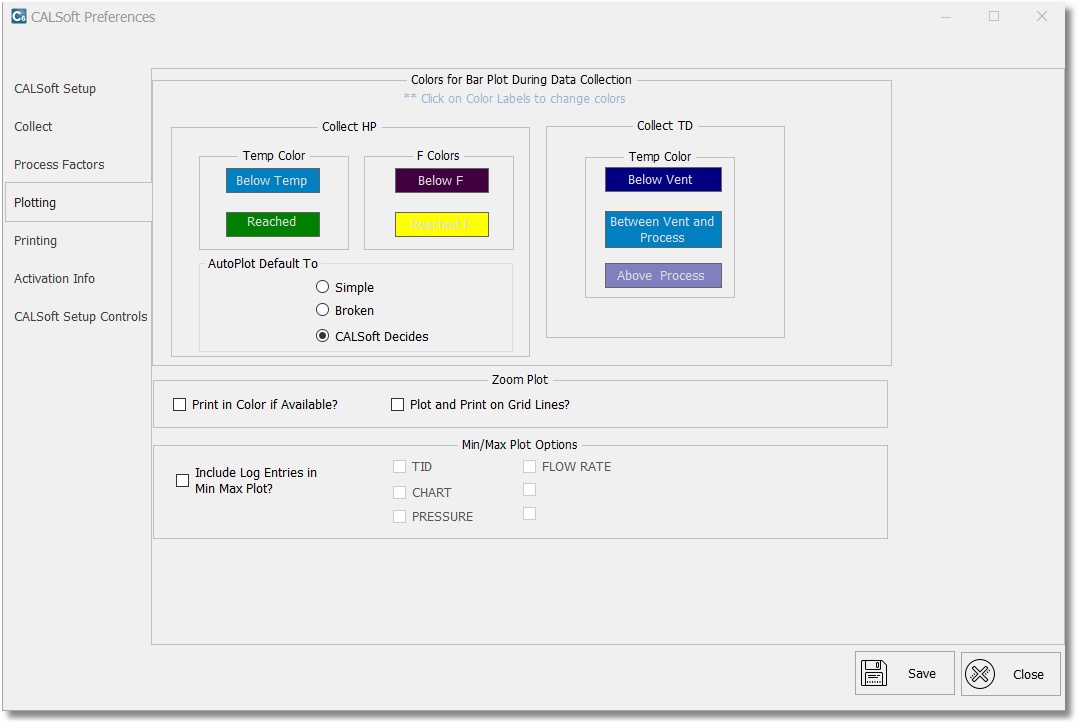
Within the Preferences window, click the "Plotting" tab to access a number of preferences:
COLORS FOR BAR PLOT DURING DATA COLLECTION- You can customize the bar colors used in the bar graph during data collection for both HP and TD. To do this, simply click on one of the colored labels and select or define a color:
- Collect HP-
- Below Temp- color of a bar when it is below the target temp
- Reached- color of a bar when it is at or above the target temp
- Below F- color of a bar when it is below the target lethality (F)
- Reached F- color of a bar when it is at or above the target lethality (F)
- Collect TD-
- Below Vent- color of a bar when it is below the target vent temp
- Between Vent and Process- color of a bar when it is above target vent but below process temp
- Above Process- color of a bar when it is above the process temp
AUTOPLOT DEFAULT TO- The AutoPlot Default To setting allows the user to have CALSoft default to Simple, Broken or the standard "CALSoft Decides" settings for an un-reviewed lead during Ball plotting.
For example, by setting this to "Simple," CALSoft will attempt to best fit a Simple Curve to the un-reviewed lead that it evaluates. By selecting "Broken," CALSoft will attempt to best fit a Broken Curve to the un-reviewed lead. "CALSoft Decides" is the default; for this, CALSoft will try to determine the best fit for the Curve for the un-reviewed lead. Users can still over-rule CALSoft and set it to a different type if they want.
NOTE: This utility does NOT affect any currently reviewed leads.
ZOOM PLOT- This is where you can customize zoom plotting options, including the following:
- Print in Color if Available- selecting this option will automatically have the zoom graph printed in color if the opportunity is available.
- Plot and Print on Grid Lines- selecting this option will always show grid lines on the zoom graph, whether plotting or printing.
MIN/MAX PLOT OPTIONS- This is where you can customize min/max plotting options, including the option to always include log entries on the min/max plot. When this is checked/selected you can then select which log labels you would like to have included.