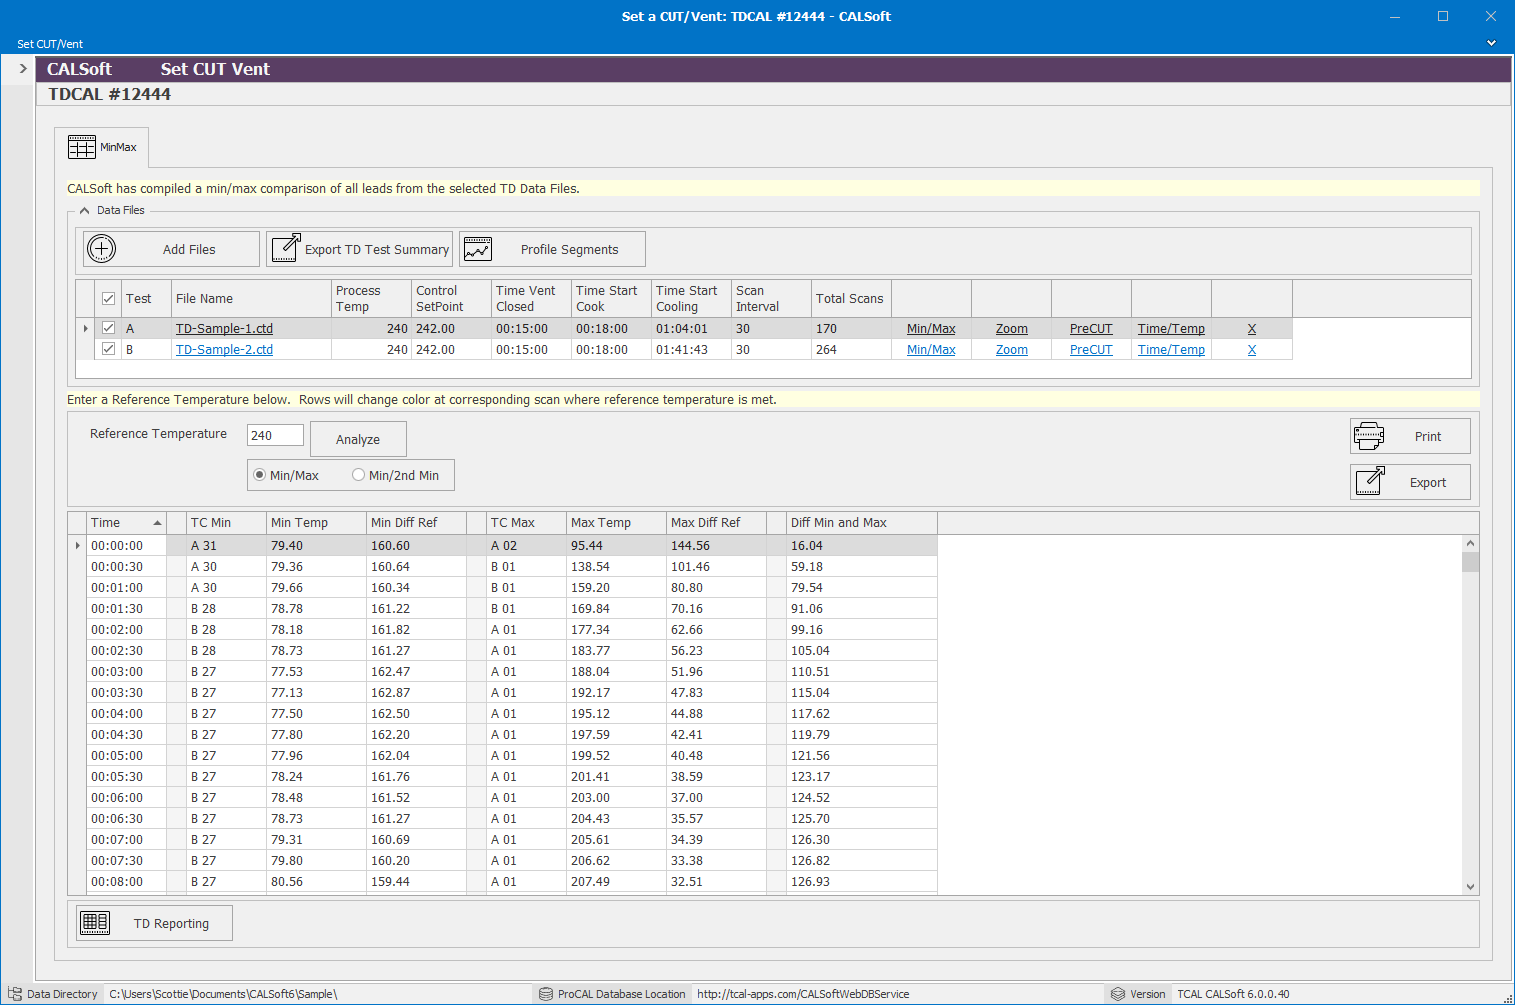
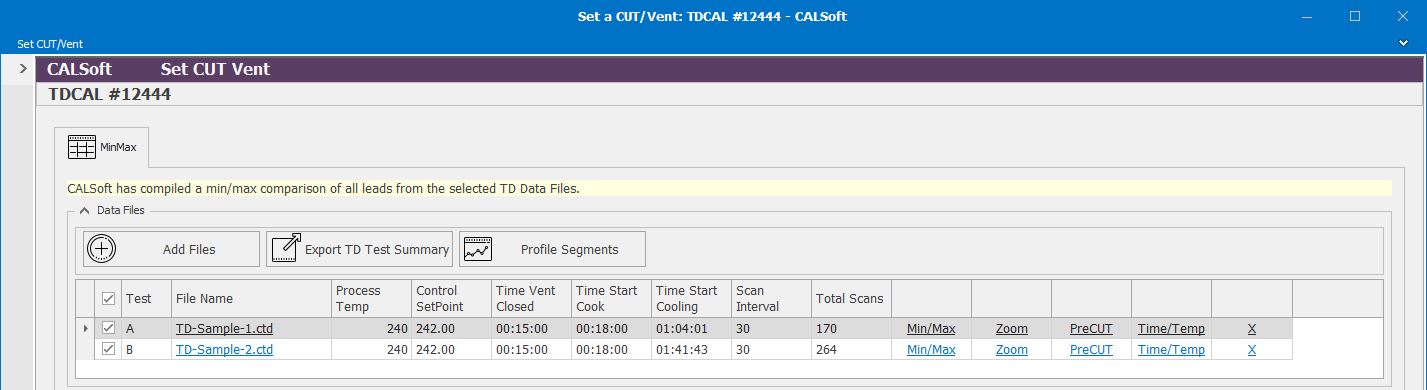
The first tab of the CUT/Vent Establishment (TDCAL Record) Page is the "MinMax" tab. Here, you have the ability to add and evaluate multiple files and their information, all on one screen. There are two main parts of the MinMax tab: the Data Files Grid and the Min/Max Grid.
Data Files Grid-
In the Data Files Grid, all temperature distribution files loaded into the current TDCAL record are displayed. Click the small arrow next to "Data Files" to show or hide this grid.
Click "Export TD Test Summary" to have CALSoft create an excel file that displays all of the TD file(s) information in an organized table.
The grid includes the following for each TD file:
- A checkbox to show or hide the data in the Min/Max Grid below
- Test- A single letter (A, B, C, ...) is given to each file as it is added (in alphabetical order of file name)
- File Name- Clicking the file name brings you to the TD File Screen
- Process Temp- The Process Temperature as determined by the user
- Control SetPoint- The Control Setpoint Temperature as determined by the user
- Time Vent Closed- The time the vent closed
- Time Start Cook- The time the come-up phase ended and the retort entered the cook phase
- Time Start Cooling- The time the cook phase ended and the retort entered the cooling phase
- Scan Interval- Time in-between each scan during TD data collection
- Total Scans- The total number of scans in the specific TD file
- The following links are included in the grid for each TD file:
- To remove the file from the TDCAL record, select the X
Min/Max Grid-
CALSoft will combine all TD data loaded into the current TDCAL record and display the 2 minimum readings from each scan (Min/Min) or the minimum and maximum from each scan (Min/Max) in the Min/Max Grid. You have the option to show/hide any of the data files by checking/unchecking them in the Data Files Grid. You can choose to display the Min/Min or Min/Max. Selecting the Min/Max option will include a column titled "Diff Min and Max," which is the difference between the minimum reading and the maximum reading for a specific scan.
Enter a "REFERENCE TEMPERATURE" and click "Analyze" and CALSoft will scan the data and visually mark the scans where that temperature has been reached or exceeded by marking them in a different color (Orange) and making the text bold. This feature will help you to determine at what time a certain temperature has been achieved during the TD tests. A single file may also be analyzed using this feature.
It should be noted that only those leads that are classified as free leads will be used in performing the Min/Max and Min/Min analysis. If your leads are not correctly classified, then go to the Equipment section within the TD File Screen or in the Time/Temp section (via the Time/Temp link in the Data Files Grid).
Click the "Print" button to print the min/max or min/min data to a pdf.
Click the "Export" button to export the data to a .csv file.
Once the temperature distribution data has been evaluated, you can move on to the establishment of the Come Up Time or Venting Schedule that will be assigned to the retort. Click "TD Reporting" to move to the Reporting tab/section.
